Execution
Trade Confirmations
Every fill with bridge and platform tickets, execution timestamps and order type.
Most brokers resell someone else's terminal. The Techfin Portal is our own software: pricing, exposure, confirmations and reconciliation in one place, built by the team that runs the liquidity.
Streaming quotes, per-symbol subscription
Exposure and P&L, refreshed continuously
Thirteen reports, CSV and XLSX export
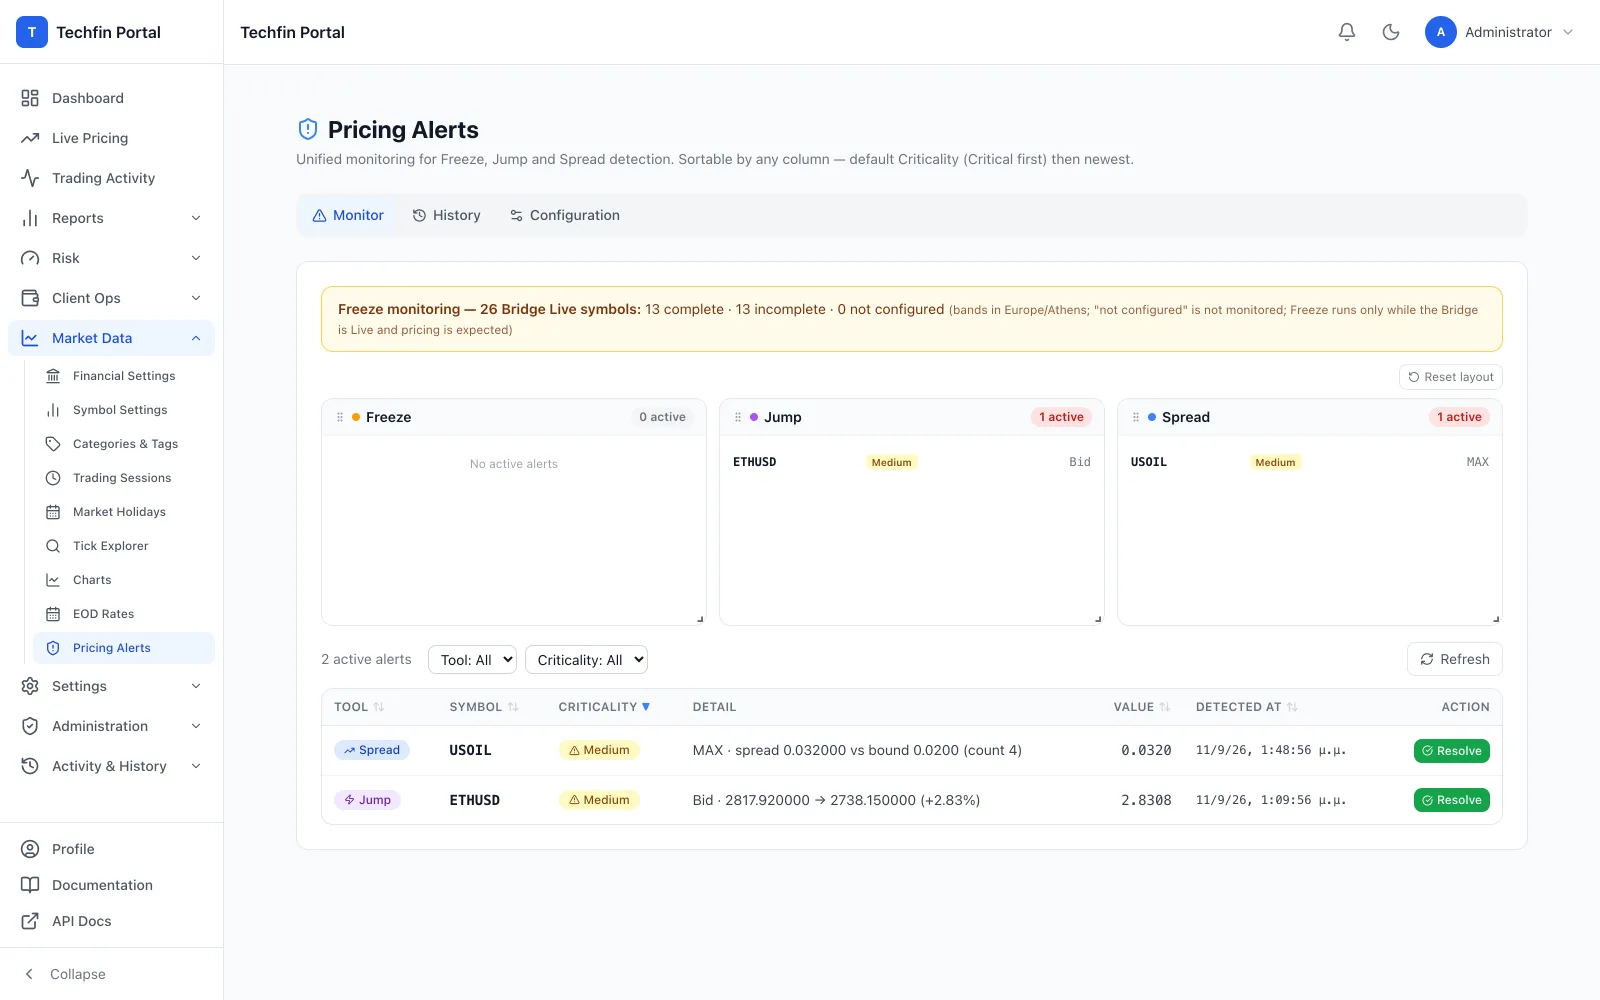
Freeze, jump and spread detection
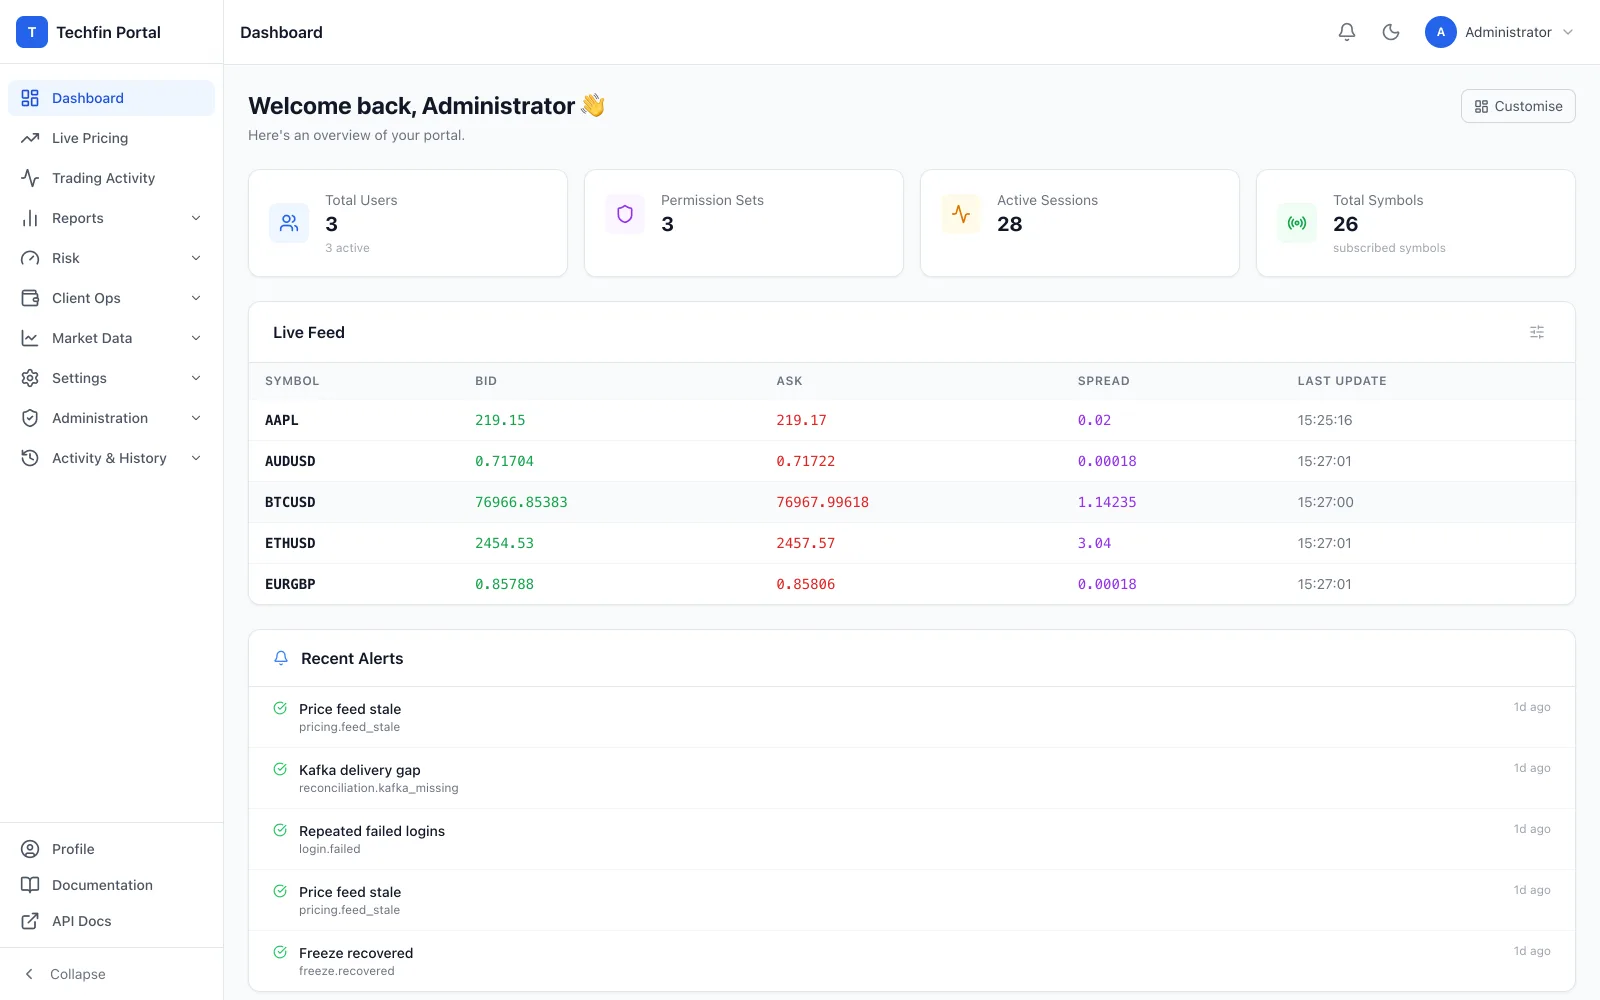
A configurable home screen — live quotes, recent alerts and audit activity. Show what your desk needs, hide what it doesn't.
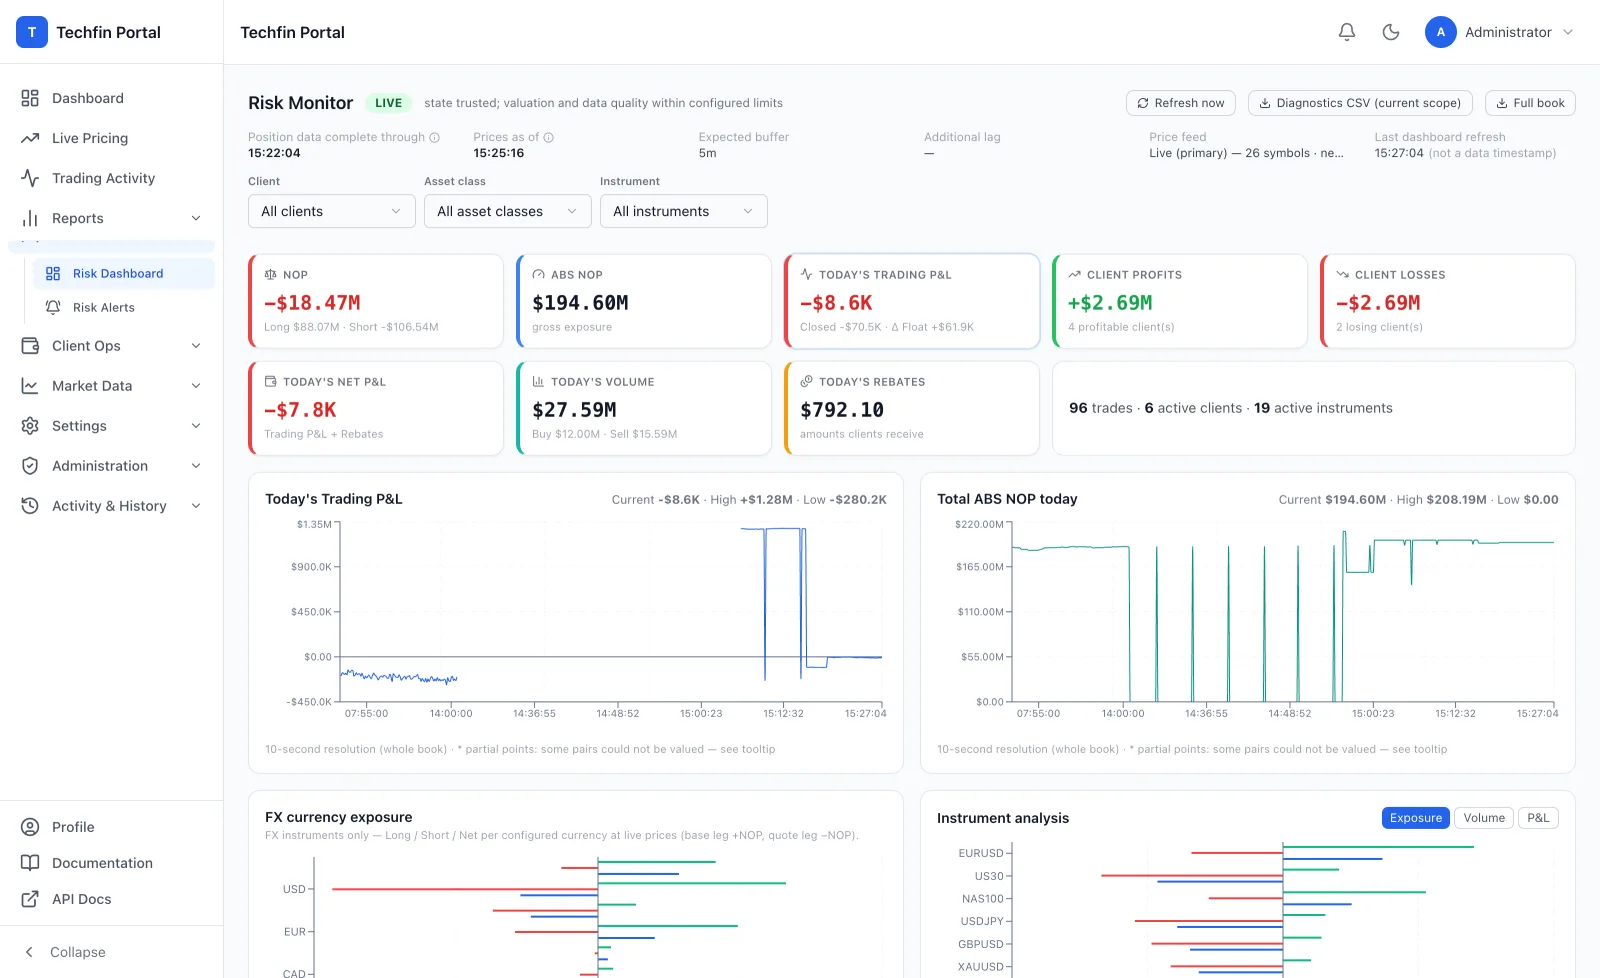
Exposure by currency and by instrument, cumulative P&L and client concentration — across Today, month-, quarter- or year-to-date.
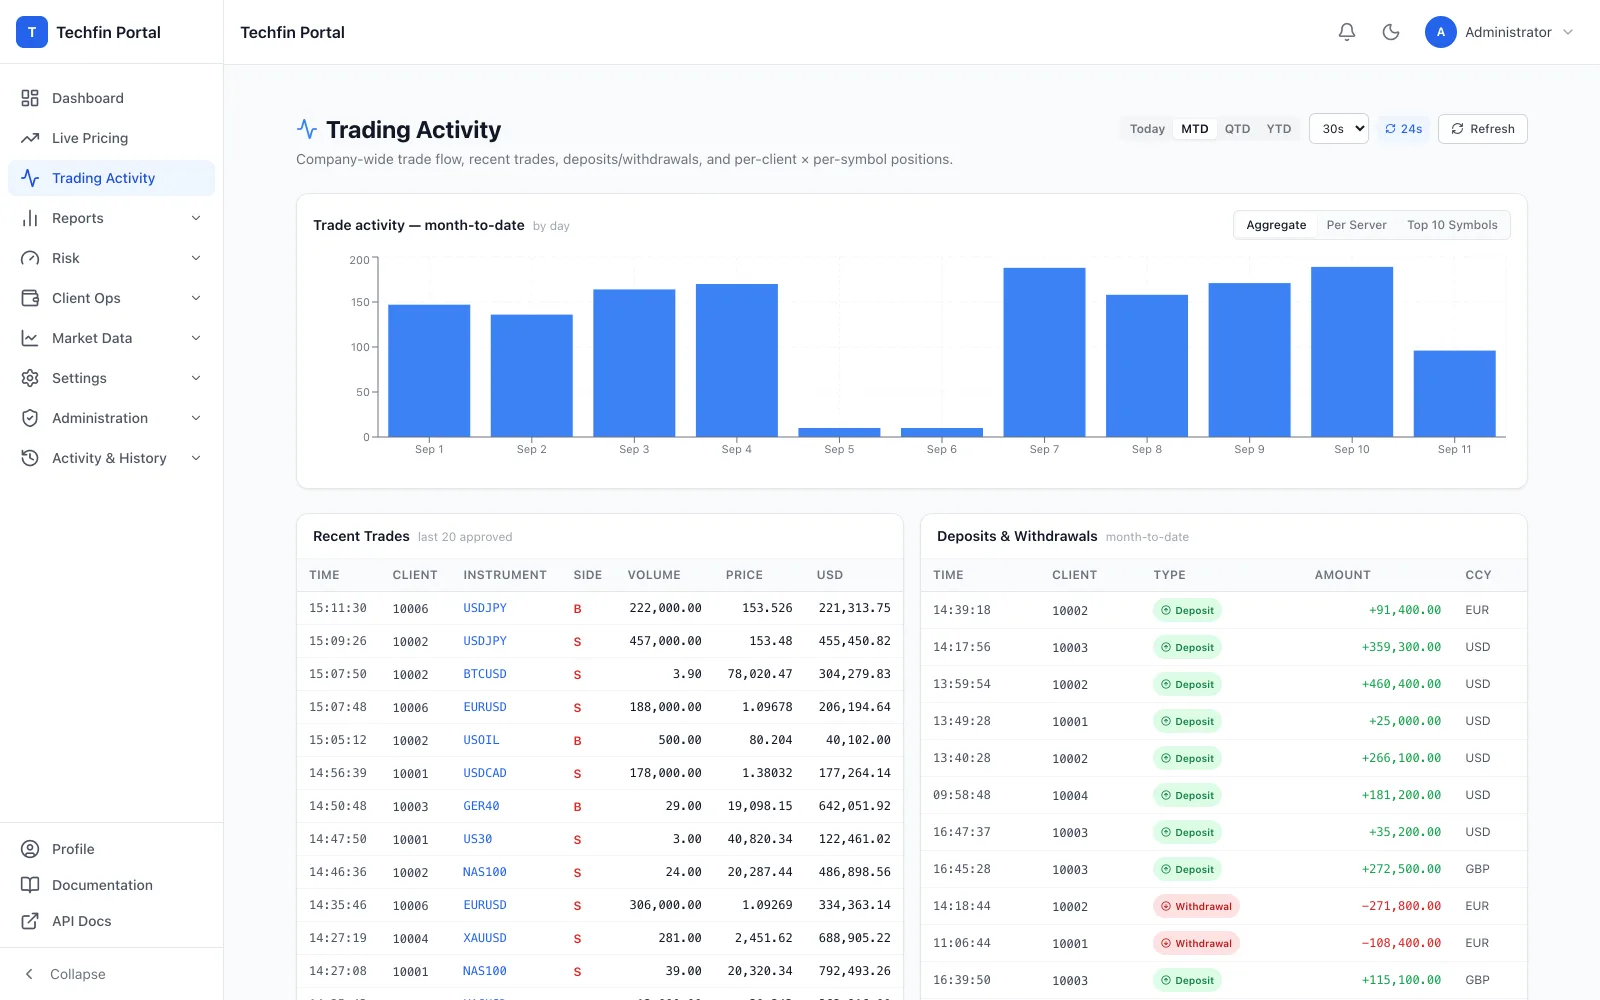
Trade volume and deposit/withdrawal movement over your chosen period, with the underlying trades one click away.
Reconciliation is where broker relationships break down. Ours is in the platform, not in a monthly spreadsheet.
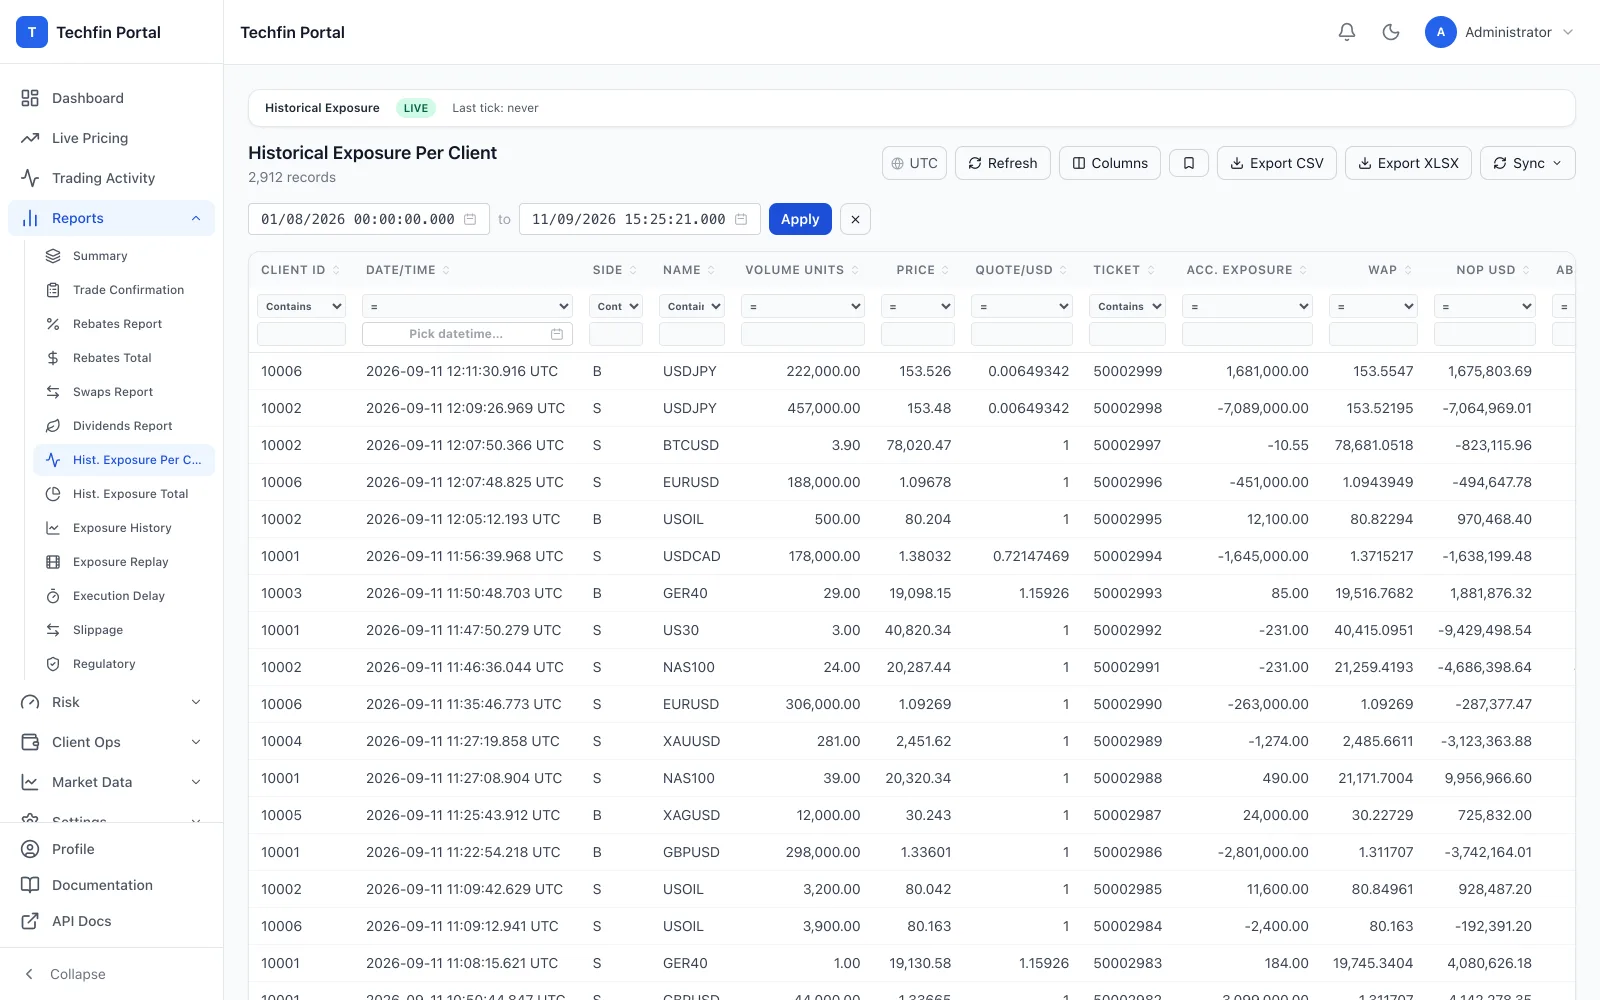
Every fill with bridge and platform tickets, execution timestamps and order type.
Per client and in aggregate — WAP, net volume and floating vs closed P&L, per day.
Rebate accrual per trade and rolled up per client and symbol.
Overnight financing and dividend adjustments, applied per instrument.
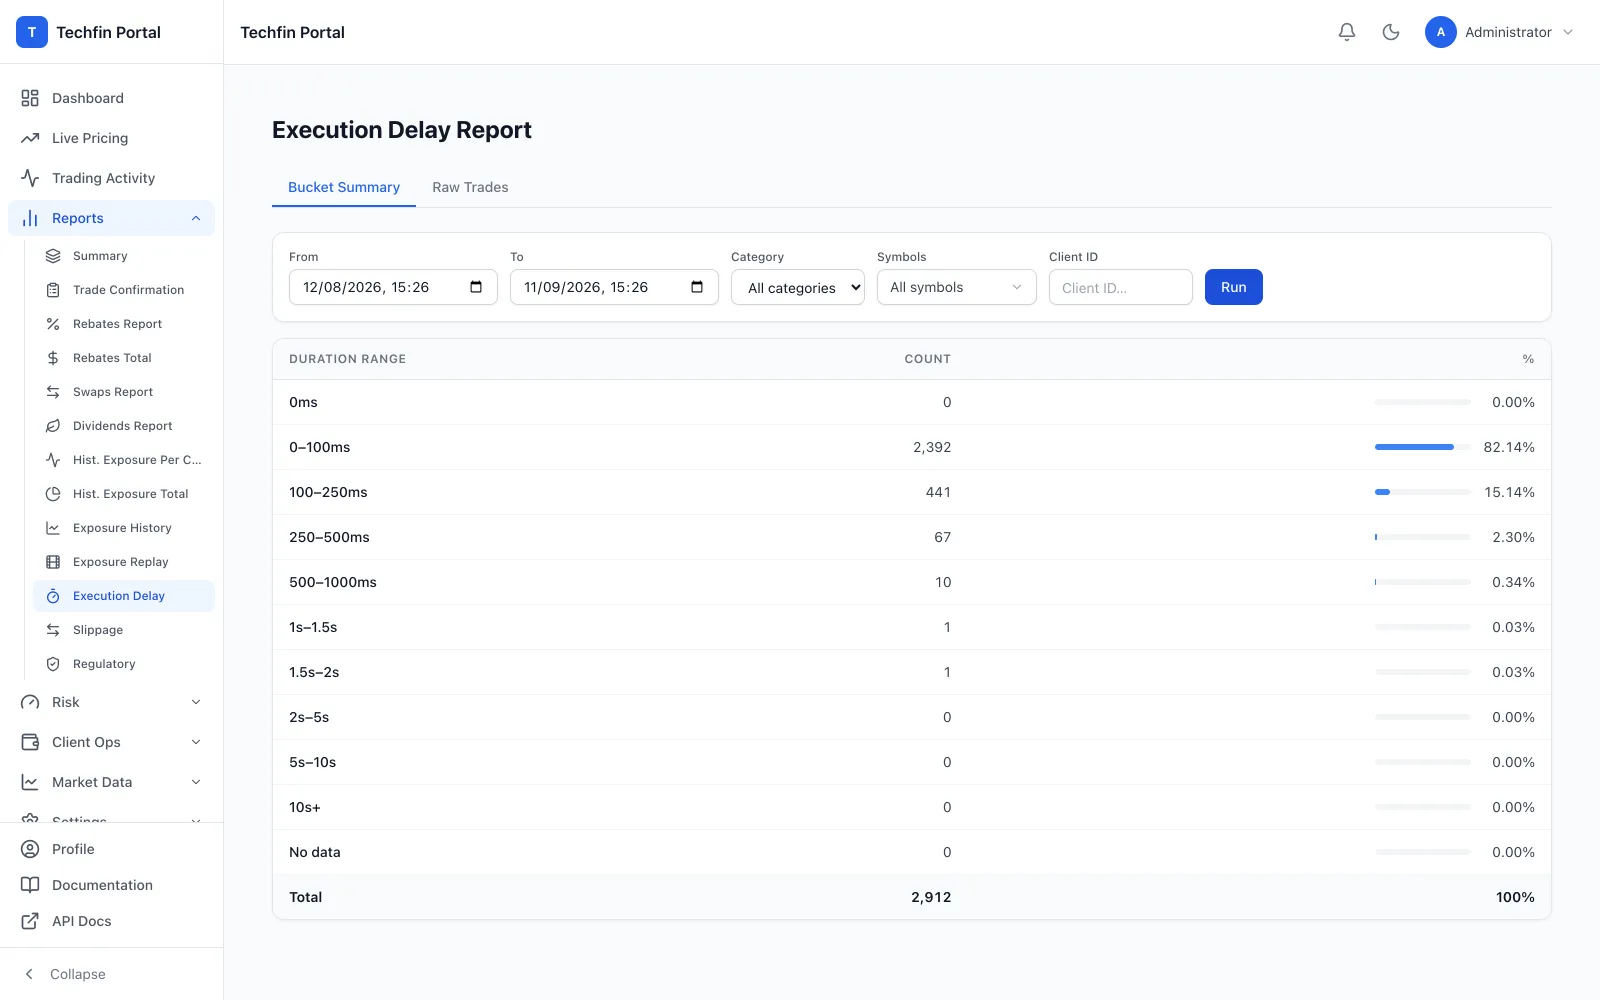
Latency buckets and slippage in price and USD — execution quality you can audit.
Trading data by instrument and client for regulatory reporting.
Fixed-interval snapshots of NOP, ABS NOP and floating P&L — compare clients, categories or instruments over any range, or replay a window minute by minute.
One page per trading day: volume, P&L, rebates and movements, ready for the morning meeting.
OHLC charts on live and imported history, and raw tick inspection with spread, gap and validity statistics per session.
Every report filters per column, respects your timezone, and exports to CSV or XLSX. Saved filters keep the views you run daily one click away.
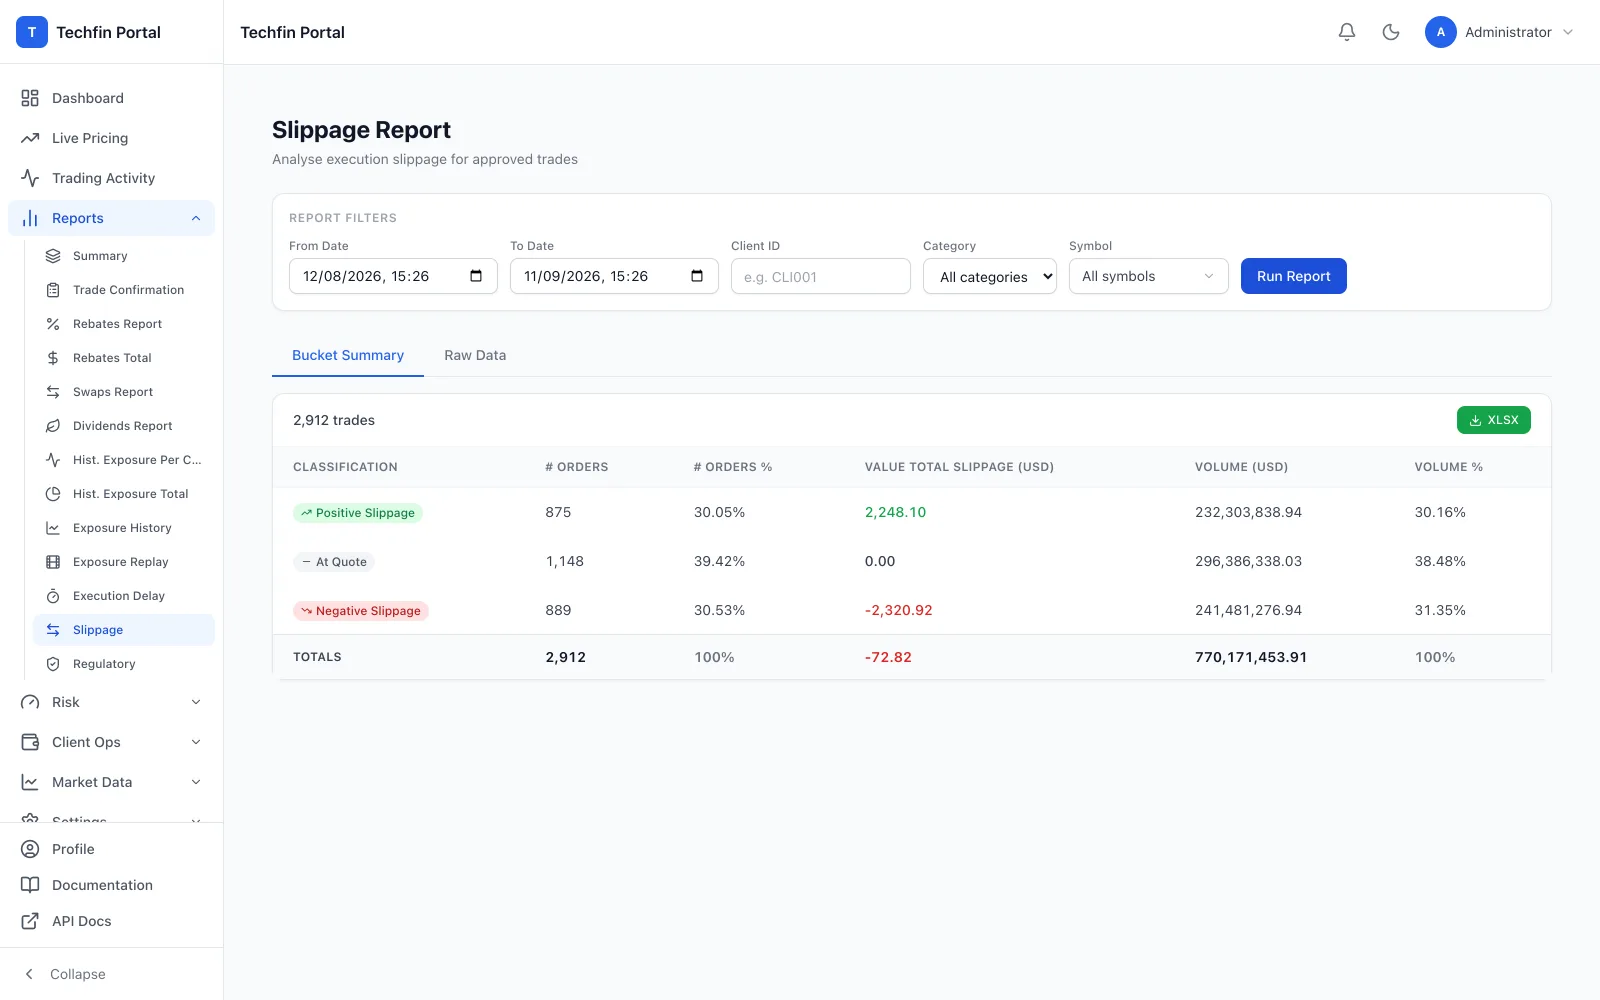
Two standing reports that turn "good execution" from a claim into a number. Both run on your flow, filter by client, category and symbol, and export to XLSX.
Positive, at-quote or negative — counted, valued in USD and weighted by volume, so a desk can see at a glance whether the book is being filled fairly.
Three detectors run on every live symbol, per tick — configurable per symbol and per time window, because a spread that's normal at 03:00 is not normal at 14:00. Freeze detection knows the trading calendar: it runs only while pricing is expected, so a closed market never raises a false alarm.
Client accounts see their own flow and nothing else — enforced server-side on every request, not hidden in the interface.
The portal is reached over a dedicated secure VPN connection per client — never from the public internet. Two-factor authentication with backup codes and trusted devices on top.
Per-module permission sets, so each user sees exactly the surface they should.
Every login, export and configuration change recorded and searchable.
We'll walk you through the portal against a live book — yours or a demo.
Book a walkthrough